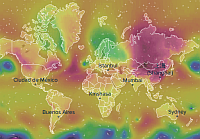
Temperature
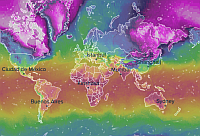
For this output data, temperature is shown for 2 metres above ground (or for other altitude, according to the settings). The calculations take into account the terrain (elevation), but with lower resolution than in reality. Therefore the models cannot differentiate, for instance, the temperature on a mountain peak or on a city square scorched by the sun. The general rule is that the centres of large cities are 1 °C to 3 °C warmer than the surrounding area or natural landscapes. Significant temperature differences over a small area are primarily caused in the winter by an inversion. A short yet noticeable cooling can also occur after a local summer storm.
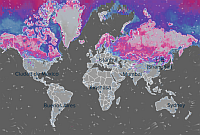
Two special layers are available. Temperature anomaly shows deviation from the long-term average for a given time. This average is based on the period 1980-2020 (40 years). Perceived temperature shows equivalent temperature perceived by humans, caused by the combined effects of sunshine, air temperature, relative humidity and wind speed. In humid conditions, the air feels much hotter. On the other hand, as airflow increases over the skin, more heat is removed and the air feels much cooler.
The Ventusky application aimed at improving awareness about meteorological events in our atmosphere. Our goal is to offer the best weather forecast to all people around the world. The name itself, Ventusky, is a combination of two words. The first is the Latin word, Ventus, means wind, and the second is the English word, Sky. The main provider of meteorological data for Ventusky is German National Meteorological Service institution (DWD) and American National Oceanic and Atmospheric Administration (NOAA).
Description of layers
Precipitation
This output data shows the total precipitation in mm for the previous 1 or 3 hours, or from a specific date (accumulated amount). The models do not differentiate more significant precipitation totals in certain mountainous areas or, on the contrary, faint drizzling from fog and low cloud cover. Forecasting precipitation totals for local storms is difficult. The numerical model does not allow for accurate calculations of the formation of local storm cells. In conversions to snowfall, 1 mm of precipitation equals roughly 1 cm of snowfall.
The areas where thunderstorm is expected are marked by icons of red lightning. The areas where snowing is expected are marked by white balls. Freezing rain is marked by exclamation marks.
Radar
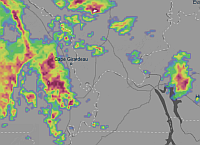
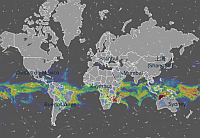
Radar layer shows current intensities of precipitation based on real or predicted data sets. This output is using not only radars but also numerical models and satelite images to improve coverage over the oceans and some land areas. Intensities of precipitation are described by colours in range from blue for a weak precipitation rate, to red for a very strong precipitation rate. Strong colours (red) need to be interpreted carefully since they may indicate not only heavy rain or snow but also thunderstorms, hail, strong winds, or tornadoes.
The areas where thunderstorm is reported are marked by icons of red lightning. The areas where snowing is expected are marked by white balls.
Cloud cover
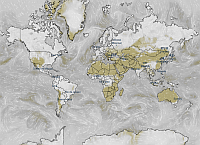
This output data shows cloud cover in percentages. Cloud patterns are very difficult to predict. The calculations also include forecasts for high cloud cover. 100% high cloud cover signifies an overcast sky. If, however, the sky is overcast with high cloud cover that is thin and the sun is shining through, it is still considered overcast, even though it may seem like a sunny day at first glance.
This output data shows cloud cover in percentages. Cloud patterns are very difficult to predict. The calculations also include forecasts for high cloud cover. 100% high cloud cover signifies an overcast sky. If, however, the sky is overcast with high cloud cover that is thin and the sun is shining through, it is still considered overcast, even though it may seem like a sunny day at first glance.
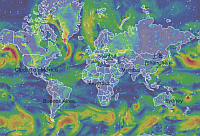
Wind
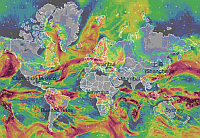
The map illustrates the average wind speed or the maximum wind speed (so-called "gusts") at 10 metres above the ground. Models run by NOAA (GFS, HRRR) calculate with 1-minute mean. However, remaining models (ICON, GEM) calculate with 10-minute mean. This can cause differences between each models. The value of the highest 1-minute sustained wind is about 14% greater than a 10-minute sustained wind over the same period. Localised increases in windiness during storms might not be precisely taken into account in model calculations. Wind direction and average speed is illustrated on the map with streamlines.
The map illustrates the average wind speed or the maximum wind speed (so-called "gusts") at 10 metres above the ground. Models run by NOAA (GFS, HRRR) calculate with 1-minute mean. However, remaining models (ICON, GEM) calculate with 10-minute mean. This can cause differences between each models. The value of the highest 1-minute sustained wind is about 14% greater than a 10-minute sustained wind over the same period. Localised increases in windiness during storms might not be precisely taken into account in model calculations. Wind direction and average speed is illustrated on the map with streamlines.
Pressure
Calculations illustrate air pressure values at sea level. The output data differentiates between pressure highs and lows as well as pressure gradients, which influence wind speed.
Calculations illustrate air pressure values at sea level. The output data differentiates between pressure highs and lows as well as pressure gradients, which influence wind speed.
CAPE
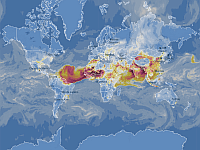
When there is possibility of storm formation, it is recommended to monitor the values of the CAPE. It represents potential energy in the atmosphere. It helps to establish the level of atmospheric instability. The greater the values reached, the greater the likelihood of the formation of a storm. Values less than 300 are low, between 300 to 1000 are weak, 1000 to 2000 are moderate, and over 2000 are high, when the possibility of the occurrence of strong storms is highly likely. Storm formation is influenced by a number of other factors, however, CAPE is an important indicator. Other parameters can also be used to predict storms (LI, wind shear, CAPE*shear, helicity)
When there is possibility of storm formation, it is recommended to monitor the values of the CAPE. It represents potential energy in the atmosphere. It helps to establish the level of atmospheric instability. The greater the values reached, the greater the likelihood of the formation of a storm. Values less than 300 are low, between 300 to 1000 are weak, 1000 to 2000 are moderate, and over 2000 are high, when the possibility of the occurrence of strong storms is highly likely. Storm formation is influenced by a number of other factors, however, CAPE is an important indicator. Other parameters can also be used to predict storms (LI, wind shear, CAPE*shear, helicity)
Freezing level
The altitude in metres at which the temperature dips below the freezing point is illustrated on the map. This altitude has a large influence on the state of precipitation. At altitudes above this level, precipitation generally occurs in solid states (snowflakes, ice crystals). At lower altitudes, on the contrary, precipitation occurs in a liquid state. This does not, however, always have to be the case. In some instances, snowfall may occur at lower altitudes as well. This is due to the fact that snow does not melt immediately at temperatures above the freezing point, but melts gradually. Therefore, primarily in low humidity, it can snow up to 400 m below this altitude. During temperature inversions, freezing precipitation may fall at this altitude.
The altitude in metres at which the temperature dips below the freezing point is illustrated on the map. This altitude has a large influence on the state of precipitation. At altitudes above this level, precipitation generally occurs in solid states (snowflakes, ice crystals). At lower altitudes, on the contrary, precipitation occurs in a liquid state. This does not, however, always have to be the case. In some instances, snowfall may occur at lower altitudes as well. This is due to the fact that snow does not melt immediately at temperatures above the freezing point, but melts gradually. Therefore, primarily in low humidity, it can snow up to 400 m below this altitude. During temperature inversions, freezing precipitation may fall at this altitude.
Snow cover
This data illustrates the anticipated height of snow cover. Prediction of snow cover development is very complex, and the values listed may differ from actual values reached (even by several centimetres). The calculations take into account the terrain (elevation), but with lower resolution than in reality. Therefore, the model cannot display the exact snow cover height in mountainous areas, where it differs greatly.
This data illustrates the anticipated height of snow cover. Prediction of snow cover development is very complex, and the values listed may differ from actual values reached (even by several centimetres). The calculations take into account the terrain (elevation), but with lower resolution than in reality. Therefore, the model cannot display the exact snow cover height in mountainous areas, where it differs greatly.
Humidity
Relative humidity is shown for 2 m above ground (or for other altitude, according to the settings). Humidity is the amount of water vapor present in the air. Relative humidity is expressed as a percentage (a higher percentage means that the air-water mixture is more humid).
Relative humidity is shown for 2 m above ground (or for other altitude, according to the settings). Humidity is the amount of water vapor present in the air. Relative humidity is expressed as a percentage (a higher percentage means that the air-water mixture is more humid).
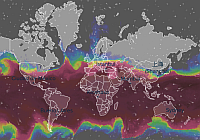
Waves
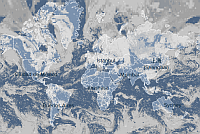
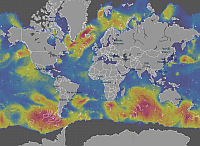
The application displays two types of waves: swells and wind waves. Waves travelling outside of their place of origin, and are thus not caused by local winds, are called swells. Waves caused by winds in that specific location are called wind waves. In the application, wind waves are marked in white and swells are marked in black. This feature allows you to quickly find areas where high wind waves are travelling in a different direction from the swells. Significant wave height is the average height (trough to crest) of the one-third highest waves. Given the variability of wave height, the largest individual waves are likely to be somewhat less than twice the reported significant wave height for a particular day. Wave period is time interval between arrival of consecutive crests at a stationary point.
The application displays two types of waves: swells and wind waves. Waves travelling outside of their place of origin, and are thus not caused by local winds, are called swells. Waves caused by winds in that specific location are called wind waves. In the application, wind waves are marked in white and swells are marked in black. This feature allows you to quickly find areas where high wind waves are travelling in a different direction from the swells. Significant wave height is the average height (trough to crest) of the one-third highest waves. Given the variability of wave height, the largest individual waves are likely to be somewhat less than twice the reported significant wave height for a particular day. Wave period is time interval between arrival of consecutive crests at a stationary point.
Air quality
Air quality is shown for 10 m above ground. Several compounds are available (PM2.5, PM10, NO2, SO2, O3, CO and dust). Air quality is mostly influenced by particulate matter (PM2.5 and PM10) during the winter or ground-level ozone (O3) during the summer. Model has lower resolution than reality. Therefore model cannot differentiate, for instance, the pollution near a highway or in a city center. Local air deterioration also occurs due to houses with stoves fueled by wood or coal. However, model is not aware about these extremely local sources of pollution.
Air quality is shown for 10 m above ground. Several compounds are available (PM2.5, PM10, NO2, SO2, O3, CO and dust). Air quality is mostly influenced by particulate matter (PM2.5 and PM10) during the winter or ground-level ozone (O3) during the summer. Model has lower resolution than reality. Therefore model cannot differentiate, for instance, the pollution near a highway or in a city center. Local air deterioration also occurs due to houses with stoves fueled by wood or coal. However, model is not aware about these extremely local sources of pollution.
Weather forecast
1) Weather icon (see the list below)
2) Temperature at 2 meters above ground
3) Precipitation total (or new snow)
4) Chance of precipitation (on the first 36 hours). The lower the value, the less likely any precipitation will occur. For example, with a probability of 100 %, rain is certain. On the contrary, with a probability of 0 % there is no risk of rain. The probabilistic forecast is based on 40 outputs of the German ICON model. Each of the outputs is run with a slightly different initial conditions and it is examined what effect this has on the forecast.
5) Wind direction at 10 meters above ground
6) Average wind speed at 10 meters above ground
7) Wind gust (displayed only if it exceed 50 km/h)
Weather icons
| Clear sky | |
| Clear sky with few clouds | |
| Partly cloudy | |
| Mostly cloudy | |
| Overcast | |
| High clouds (cirrus) | |
| Fog (low stratus clouds) | |
| Mixed with rain showers | |
| Mixed with mixture of snow and rain showers | |
| Mixed with snow showers | |
| Overcast with mixture of snow and rain | |
| Overcast with snow | |
| Overcast with rain | |
| Overcast with heavy rain | |
| Overcast with light rain | |
| Overcast with drizzle | |
| Rain, thunderstorms likely | |
| Snow, thunderstorms likely | |
| Thunderstorms likely | |
| Hail likely |
Numerical models
In order to predict the weather, a meteorologist needs to know basic variables such as temperature, pressure, humidity, and wind current. The atmosphere is a physical system whose behaviour is governed by the laws of physics and can be described using mathematic equations. The equations themselves are extremely complex and high-performance computers are needed to solve them. The solutions to these equations are reached using numerical models that calculate future weather development (temperatures, pressure, precipitation, etc.), in which the input data come from, for example, observations from meteorological stations or satellite data.
In the Ventusky application, you will find data from the American model, GFS, the German ICON, the Canadian GEM and several regional models (ICON EU, ICON DE, NBM, HRRR). Moreover, some special models are available (SILAM for air quality, RTOFS for sea currents and sea temperature or OVATION for aurora forecast). When interpreting the data from the models, it is important to keep in mind that the numerical model predicts the atmosphere in simplified form.
Model ICON
This is a global model developed by the German National Meteorological Service institution (DWD).
The resolution of the model is roughly 13 km. It is run every 6 hours. The regional model, ICON-EU uses a 7 km grid. Moreover,
it is updated every 3 hours. This makes it the most useful model readily available and covering the whole of Europe.
Model GFS
This is a global model developed by the American National Oceanic and Atmospheric Administration (NOAA).
The resolution of the model is roughly 22 km. Calculations are done in three-hour increments for 10 days. Model is updated every 6 hours.
Model GEM
This is the global model developed by the Canadian Meteorological Centre (CMC). The resolution of the model is roughly 25 km. Calculations are done in three-hour increments for 10 days. Model is updated every 12 hours.
Model HRRR
This is a regional model developed by the American National Oceanic and Atmospheric Administration (NOAA).
The resolution of the model is roughly 2 km. Calculations are done in one-hour increments for 16 hours. Model is updated every hour.
EURAD and USRAD
Two models, EURAD and USRAD, are based on current radar and satellite readings. These models are able to show precisely current precipitation in US and Europe. Models are updated every 10 minutes.
Weather fronts
FAQ
The timeline below the map uses the time that you have set in your device. By contrast, the card of the particular location uses the local time of this location. The time zone used is shown under the location title (e.g. UTC+1).
Why does a forecast not correspond?
Numerical models only provide a simplified insight into phenomena in the atmosphere, and no forecast is 100% certain. Especially in the mountains, the weather differs even in a very small territory, which a model can’t capture correctly. The Ventusky application in itself doesn’t forecast the weather. Ventusky itself is a advanced visualization tool, which uses data from the best numerical models (GFS, ICON, GEM etc).
Why do wind speeds on Ventusky differ from values in other apps?
Differences may be down to several causes. You must always compare identical data. We display wind gusts and average wind speed. Nevertheless, average wind speed may be computed for a period of 1 minute, or 10 minutes. Models operated by NOAA (GFS, HRRR) use 1-minute average. The remaining models (ICON, GEM) use 10-minute average. This may cause differences between individual models and values being compared from other apps. Differences manifest mainly in the case of tropical cyclones, where a 1-minute average value is markedly higher than a 10-minute average value of wind speed. Differences may also occur owing to the fact that we display data from numerical models that may not include all the data that have been measured (if, for example, a private station on a Caribbean island measures an average wind speed over 200 km/h during a hurricane, such data will not enter the models displayed by us as the models only utilise a professional network of stations, which might be sparse in some areas).
What models do you use?
We use several weather models (see section Numerical models above). You can find information on the model displayed in the upper right corner on the main screen or in the setting section (there you can also change the model).
How often is the data in your app updated?
We always acquire the latest data. As a rule, the numerical models are updated every 6, 3 or 1 hours. The precise interval depends on the particular model.
What the colors means and how can I display the scale?
The colours correspond with the feeling that the given weather phenomena evokes in us. For temperature, blue illustrates cool weather while dark red depicts hot desert air. For precipitation, we concentrated on the danger associated with it. Blue colours represent low precipitation totals that will not result in floods. Orange and red hues, on the other hand, are dangerous and may bring flooding. Values that particular colors exactly represent are display directly on the map. There is no need for scale in the app and we do not offer the possibility to display scale.
What are the altitudes of the clouds layers?
These categories (low, middle, high) are based on the standard definition (see Cloud levels).
A forecast changes markedly all of a sudden after a certain time. What causes it?
After such time, there’ll probably be a change of the numerical model used. For example, the ICON model is only computed for the next 72 hours, and the data is then displayed from the GFS model, which may have a different forecast. Always watch what model is currently used in the upper right corner.
Why do you need access to my current location?
If you grant Ventusky access information about your current location, the app will use your location to get weather data and show you the weather forecast for your location. This information is not further processed, stored or transmitted to third parties. We don't use any of your data for marketing or advertising purposes.
Will you add some new feature?
We have got lots of ideas for new features. We are working on them at the moment. The Ventusky project is continuously developing. Watch our Facebook or Twitter for more information.