The following is some information and a number of tips that will be useful when using the Ventusky application.
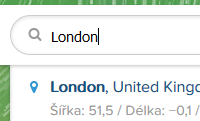
Searching
In the Ventusky application, you can use the search feature to find your location, which you can add to your favourite locations via the side panel (by clicking on the star).
Your favourite locations will be highlighted on the map, so you can always find them quickly. In the search feature, you can enter the name of your city or specific GPS
coordinates (i.e. in the format: 50.2, 40.3).
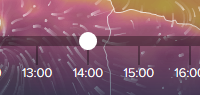
Timeline
By using the timeline at the bottom of the page, you can control the data displayed on the map. On this timeline, you can choose the forecast period for which you would like
data to be displayed. Use the buttons to play the animation or move the data one forecast period forward or backward. The time is displayed in the time zone that is set up on your computer.
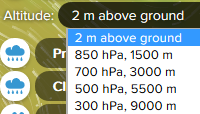
Altitude
You will generally be most interested in what is happening in the atmospheric layer closest to the surface of the earth.
However, if you are a pilot, or have a more detailed interest in meteorology, you will no doubt appreciate the option of seeing
data from the various level above the surface of the Earth. To display these data, you can use the pop-up form labelled Altitude.
This setting is available for temperature and wind measurements only.
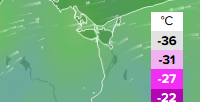
Units
To change the units of measurement (i.e. from km/h to m/s or °C to °F), click on the scale in the lower right-hand corner.
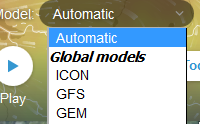
Choosing a model
In the lower left-hand corner, you can choose your numeric model. You can choose data from the ICON, GFS, and GEM models.
The Automatic option switches data between ICON and GFS models automatically so that it always offers data in the highest resolution possible.
The ICON model is calculated in a higher resolution than GFS, but is available only for the nearest 72 hours, and only for certain values.
For longer periods, or to display certain values (such as CAPE, Snow Cover), you must switch to GFS, and choosing Automatic mode ensures automatic
switching over between models. The models offered are among the most accurate in the world, and it is recommended to monitor and compare the calculations of all of the models.
More detailed information about the differences between the models is listed below.
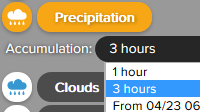
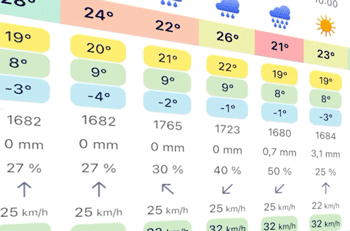
Accumulated precipitation
Precipitation is always displayed for a specific time period. If, for example, you select to display precipitation for 12:00, the value displayed is the sum of total
precipitation either for the previous hour or for the previous three hours (or from a certain date). You can use the switch option to change the time period for accumulated
precipitation either to accumulation per hour (only for the ICON model), per three hours, or from a specific date.
Side panel
On the side panel, you can display more detailed information about the location. The side panel is displayed after clicking on a city or your choice or
location on the map. Data in the side panel are displayed in the local time of the given location (contrary to data on the map, which is displayed in the
time zone set up on your computer).

Shortcuts
Ventusky supports several keyboard shortcuts. You can try following keys:
- You can easily change time with arrow keys (← and →)
- Key P activates / deactivates presentation mode (hide GUI). This is a great feature for presentation.
- Key G shows / hides values in grid on the map
- Key M switches models
- Key W turns off / on wind animation
- Key I turns off / on weather map interpolation
In order to predict the weather, a meteorologist needs to know basic variables such as temperature, pressure, humidity, and wind current.
The atmosphere is a physical system whose behaviour is governed by the laws of physics and can be described using mathematic equations.
The equations themselves are extremely complex and high-performance computers are needed to solve them. The solutions to these equations
are reached using numerical models that calculate future weather development (temperatures, pressure, precipitation, etc.), in which the input data come from,
for example, observations from meteorological stations or satellite data.
In the Ventusky application, you will find data from the American model, GFS, the Canadian GEM, the German ICON and several regional models (ICON EU, COSMO, NBM, HRRR). When interpreting the data from the models, it is important to keep in mind that the numerical model predicts the atmosphere in simplified form.
Model ICON
This is a global model developed by the German National Meteorological Service institution (DWD).
The resolution of the model is roughly 13 km. It is run every 6 hours. The regional model, ICON-EU uses a 7 km grid. Moreover,
it is updated every 3 hours. This makes it the most useful model readily available and covering the whole of Europe.
Model GFS
This is a global model developed by the American National Oceanic and Atmospheric Administration (NOAA).
The resolution of the model is roughly 22 km. Calculations are done in three-hour increments for 10 days. Model is updated every 6 hours.
Model GEM
This is the global model developed by the Canadian Meteorological Centre (CMC). The resolution of the model is roughly 25 km. Calculations are done in three-hour increments for 10 days. Model is updated every 12 hours.
Model HRRR
This is a regional model developed by the American National Oceanic and Atmospheric Administration (NOAA).
The resolution of the model is roughly 2 km. Calculations are done in one-hour increments for 16 hours. Model is updated every hour.
EURAD and USRAD
Two models, EURAD and USRAD, are based on current radar and satellite readings. These models are able to show precisely current precipitation in US and Europe.
Models are updated every 10 minutes.
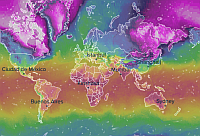
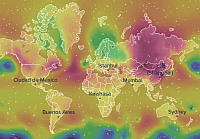
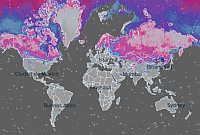
Temperature
For this output data, temperature is shown for 2 metres above ground (or for other altitude, according to the settings). The calculations take into account the terrain (elevation), but with lower resolution than in reality. Therefore the models cannot differentiate, for instance, the temperature on a mountain peak or on a city square scorched by the sun. Significant temperature differences over a small area are primarily caused in the winter by an inversion. A short yet noticeable cooling can also occur after a local summer storm.
Two special layers are available. Temperature anomaly shows deviation from the long-term average for a given time. This average is based on the period 1980-2020 (40 years). Perceived temperature shows equivalent temperature perceived by humans, caused by the combined effects of sunshine, air temperature, relative humidity and wind speed. In humid conditions, the air feels much hotter. On the other hand, as airflow increases over the skin, more heat is removed and the air feels much cooler.
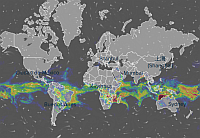
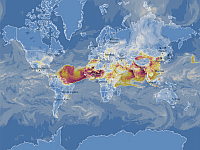
Precipitation
This output data shows the total precipitation in mm for the previous 1 or 3 hours, or from a specific date (accumulated amount). The models do not differentiate more significant precipitation totals in certain mountainous areas. Forecasting precipitation totals for local storms is difficult. The numerical model does not allow for accurate calculations of the formation of local storm cells. In conversions to snowfall, 1 mm of precipitation equals roughly 1 cm of snowfall.
The areas where thunderstorm is expected are marked by red dots (and animation of lightning). The areas where snowing is expected are marked by white dots. Freezing rain is marked by exclamation marks.
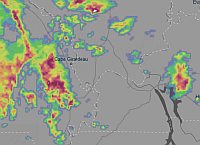
Radar
Radar layer shows current intensities of precipitation based on real or predicted data sets. This output is using not only radars but also numerical models and satelite images to improve coverage over the oceans and some land areas. Intensities of precipitation are described by colours in range from blue for a weak precipitation rate, to red for a very strong precipitation rate. Strong colours (red) need to be interpreted carefully since they may indicate not only heavy rain or snow but also thunderstorms, hail, strong winds, or tornadoes.
The areas where thunderstorm is reported are marked by icons of red lightning. The areas where snowing is expected are marked by white balls.
Cloud cover
This output data shows cloud cover in percentages. Cloud patterns are very difficult to predict. The calculations also include forecasts for high cloud cover. 100% cloud cover signifies an overcast sky. If, however, the sky is overcast with cloud cover that is thin and the sun is shining through, it is still considered overcast, even though it may seem like a sunny day at first glance.
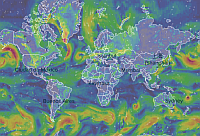
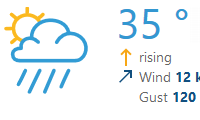
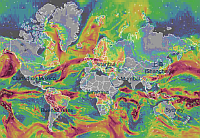
Wind
The map illustrates the average wind speed or the maximum wind speed (so-called "gusts") at 10 metres above the ground.
Models run by NOAA (GFS, HRRR) calculate with 1-minute mean. However, remaining models (ICON, GEM) calculate with 10-minute mean. This can cause differences between each models. The value of the highest 1-minute sustained wind is about 14% greater than a 10-minute sustained wind over the same period.
The calculation does not take into account exposed areas (hilltops, open fields) where wind speed will be greater than that in a city or valley. Localised increases in windiness during storms are also not taken into account in model calculations.
Wind direction and average speed is illustrated on the map with streamlines.
Pressure
Calculations illustrate air pressure values at sea level. The output data differentiates between pressure highs and lows as well as pressure gradients, which influence wind speed.
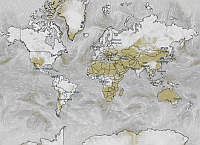
CAPE
When there is possibility of storm formation, it is recommended to monitor the values of the CAPE. It represents potential energy in the atmosphere. It helps to establish the level of atmospheric instability. The greater the values reached, the greater the likelihood of the formation of a storm. Values less than 300 are low, between 300 to 1000 are weak, 1000 to 2000 are moderate, and over 2000 are high, when the possibility of the occurrence of strong storms is highly likely. Storm formation is influenced by a number of other factors, however, CAPE is an important indicator.
Freezing level
The altitude in metres at which the temperature dips below the freezing point is illustrated on the map. This altitude has a large influence on the state of precipitation. At altitudes above this level, precipitation generally occurs in solid states (snowflakes, ice crystals). At lower altitudes, on the contrary, precipitation occurs in a liquid state. This does not, however, always have to be the case. In some instances, snowfall may occur at lower altitudes as well. This is due to the fact that snow does not melt immediately at temperatures above the freezing point, but melts gradually. Therefore, primarily in low humidity, it can snow up to 400 m below this altitude. During temperature inversions, freezing precipitation may fall at this altitude.
Snow cover
This data illustrates the anticipated height of snow cover. Prediction of snow cover development is very complex, and the values listed may differ from actual values reached (even by several centimetres). The calculations take into account the terrain (elevation), but with lower resolution than in reality. Therefore, the model cannot display the exact snow cover height in mountainous areas, where it differs greatly.
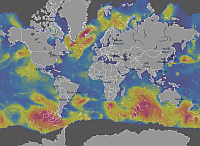
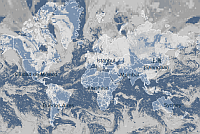
Waves
The application displays two types of waves: swells and wind waves. Waves travelling outside of their place of origin, and are thus not caused by local winds, are called swells. Waves caused by winds in that specific location are called wind waves. In the application, wind waves are marked in white and swells are marked in black. This feature allows you to quickly find areas where high wind waves are travelling in a different direction from the swells. Significant wave height is the average height (trough to crest) of the one-third highest waves. Given the variability of wave height, the largest individual waves are likely to be somewhat less than twice the reported significant wave height for a particular day. Wave period is time interval between arrival of consecutive crests at a stationary point.
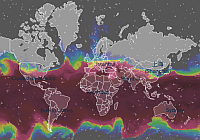
Humidity
Relative humidity is shown for 2 m above ground. Humidity is the amount of water vapor present in the air. Relative humidity is expressed as a percentage (a higher percentage means that the air-water mixture is more humid).
Air quality
Air quality is shown for 10 m above ground. Several compounds are available (PM2.5, PM10, NO2, SO2, O3, CO and dust). Air quality is mostly influenced by particulate matter (PM2.5 and PM10) during the winter or ground-level ozone (O3) during the summer. Model has lower resolution than reality. Therefore model cannot differentiate, for instance, the pollution near a highway or in a city center. Local air deterioration also occurs due to houses with stoves fueled by wood or coal. However, model is not aware about these extremely local sources of pollution.
 | Clear sky |
 | Clear sky with few clouds |
 | Partly cloudy |
 | Mostly cloudy |
 | Overcast |
 | High clouds (cirrus) |
 | Fog (low stratus clouds) |
 | Mixed with rain showers |
 | Mixed with mixture of snow and rain showers |
 | Mixed with snow showers |
 | Overcast with mixture of snow and rain |
 | Overcast with snow |
 | Overcast with rain |
 | Overcast with heavy rain |
 | Overcast with light rain |
 | Overcast with drizzle |
 | Rain, thunderstorms likely |
 | Snow, thunderstorms likely |
 | Thunderstorms likely |
 | Hail likely |